What is an Attribution Model?
An attribution model is a tool that allows marketers to measure the value of each touchpoint in the customer journey before successfully converting/purchasing. Google describes an attribution model as “the rule, or set of rules, that determines how credit for sales and conversions is assigned to touchpoints in conversion paths”.
Users often interact with a brand several times before becoming a paying customer whilst they advance down your sales funnel. Your funnel may change depending on; the price of your product, how well known your brand is, the type of industry, and many other factors, but they tend to boil down to the same 3 key steps. Awareness, Interest, Action.
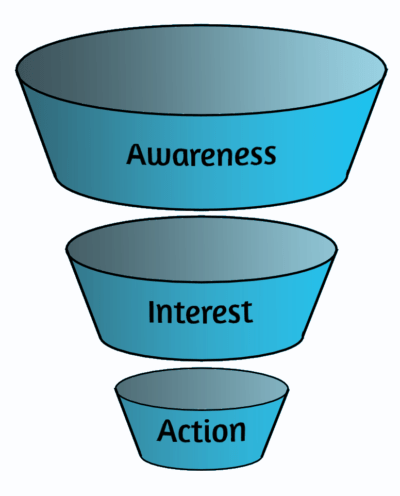
This funnel is a simplification and representation of the steps a consumer will take before becoming a customer.
- First, they may become aware of your brand from a display ad, YouTube ad, or other brand awareness campaign. This would fall into funnel step 1 – Awareness
- The user could then seek out reviews, visit your product or service pages, subscribe to your company newsletter, etc. This would put this person in the second funnel step – Interest
- Once the user shows interest in your services, this could lead to purchase intent, then the user subsequently making a purchase or interaction. This is the final step – Action
Why Are Attribution Models Important?
Attribution models provide us with different ways to interpret data from our marketing campaigns and allow for a deeper understanding of the customer journey.
On Google ads, when you create or import a conversion action, the default attribution model is “Last Click”. This means that when a user converts, all of the credit is assigned to the last click they made on one of your ads. The main problem with this is that it completely ignores any other interaction that the user has had with your brand.
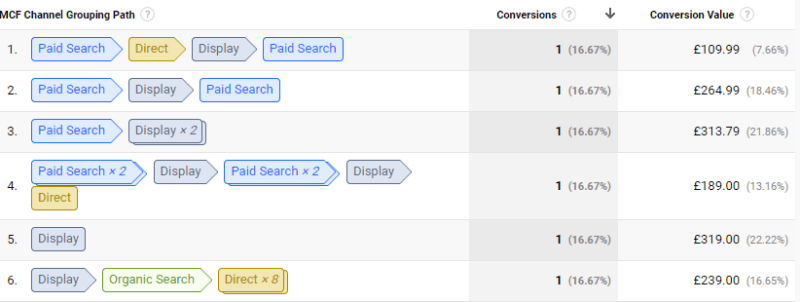
The screenshot below shows an example taken from the “Top Conversion Paths” report in Google Analytics from an e-commerce website with an advanced filter to show conversions with “Display” in the Multi-Channel Funnels Grouping Path.
In this example, we can see 6 conversions from users who saw a display ad. However, Google Ads, with the Last Click attribution model on the conversion action, only reported 2 conversions from the display campaign. This was from numbers 5 and 3, the remainder provided no credit to the display campaigns.
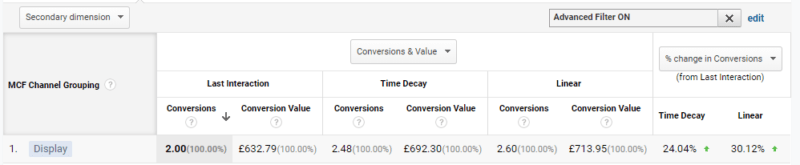
Using the Model Comparison Tool – found under Conversions, then Multi-Channel Funnels in Google Analytics – we can observe changes in the number of conversions and conversion value fields occurring when each attribution model is compared against one another.
In the first columns, we can see the results for “Last Interaction”, next to this is “Time Decay” and on the right side columns are the results for “Linear”. This allows us to better understand the significance of our display campaigns played in the purchase decision of the customer rather than only focusing on the final step of the journey.
Different Types Of Attribution Models
The Attribution models you will probably already be most familiar with are the options available from Google Ads. These are; Last Click, First Click, Position-Based, Linear, Time Decay, and Data-Driven. Each of these attribution models credits different touchpoints with differing value. This is explained for each below.
Last Click
A last-click attribution model assigns 100% of the credit for the conversion to the last touch-point.
First Click
A last click attribution model assigns 100% of the credit for the conversion to the first touch-point.
Position Based
A position-based attribution model assigns 40% of the credit for the conversion to the first, and last touch-point. The remainder is distributed evenly amongst the remaining touch-points.
Linear
A linear attribution model equally distributes credit amongst all touch-points.
Time Decay
A time decay attribution model distributes less credit to the earliest touch-points and more to the touch-points closest to the conversion.
Data-Driven
A data-driven attribution model is different in that it uses historical conversion data to calculate the actual contribution of each touch-point.
Differences Between Attribution Models on Google Ads & Google Analytics
You may have noticed that when creating a goal in Google Analytics it does not provide you with the same option to apply an attribution model like on Google Ads. This allows us to compare different attribution models on Google Analytics using the Model Comparison Tool.
The attribution models available on Google Ads and Google Analytics are slightly different. Whereas Google Ads includes the attribution models listed above, Google Analytics does not have data-driven, but does have an extra two attribution models; last Google Ads click, and last non-direct click.
The “Last Google Ads Click” attribution model seen in Google Analytics works the same as the Last Click model on Google Ads.
Google Analytics, on the other hand, uses the last non-direct click attribution model for non-multi channel funnel reports and the last click model for multi-channel funnel reports.
The differences between how the attribution models work on Google Analytics and Google Ads can result in discrepancies in the results between the two. For example, if a user clicked on a search ad, then later visited the website organically and converted, Google Ads would attribute this as a conversion from the search campaign, whereas Google Analytics would class this as an organic conversion.
Which Is the Right Attribution Model to Use?
It’s important to use a variety of attribution models to interpret your conversion data in order to understand the journey customers take before successfully converting. Using a last-click attribution, for example, completely disregards every previous step a user has taken, whereas using a first click attribution model leaves you with the opposite problem. Comparing these two, however, can help us understand which advertising means are best to encourage customers to explore our brands in the first place, and what type of ads make them successfully convert further down the funnel.
On Google Ads test multiple attribution models and figure out which one works best for you. Position based and Linear attribution models are great to get started with, as you may now start seeing credit for conversions distributed across your brand campaigns, product campaigns, display, YouTube, etc.
How to Use Your Understanding of Attribution Modelling to Improve Your Google Ads Campaigns
By comparing attribution models and analysing the conversion paths of users we can begin to understand the full customer journey beyond just the final click. Using the Top Conversion Paths tool in Google Analytics we can understand how users interact with our brand on-line before becoming a converting customer.
On Google Analytics navigate and expand “Conversions” in the left sidebar, expand the dropdown for “Multi-Channel Funnels”, and select “Top Conversion Paths”. Here we can see the steps each converting user has taken before completing the conversion action.
Make sure you have the correct conversion actions selected in the top left corner and set the path length to “All” to see information for all conversions. The 3rd option, “Lookback Window” can be set from anywhere from 1 day to 90. This option determines how many days leading up to the conversion action we can analyse.
Next, we can create a secondary dimension to give us more information about the types of content the user has interacted with. Click on “Secondary Dimension” and experiment with some of the options (Ad Group Path or Search Query Path are great to get started on).
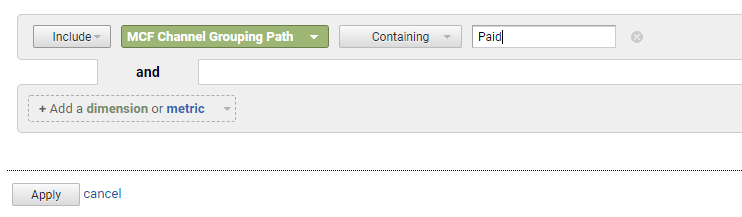
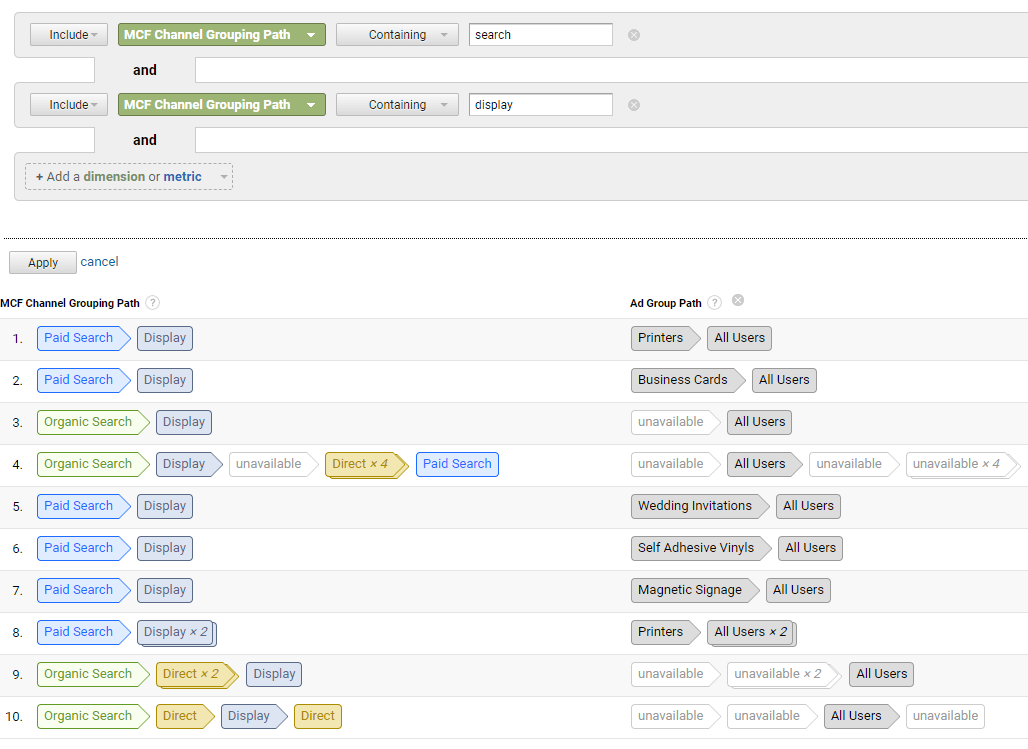
We can then filter our results to only show the details for conversions where the user has interacted with an ad. This can be done by clicking “Advanced” at the top right of the main table. When here, select “MCF Channel Grouping Path”, enter “Paid” in the empty box and click “Apply” as seen in the image below.
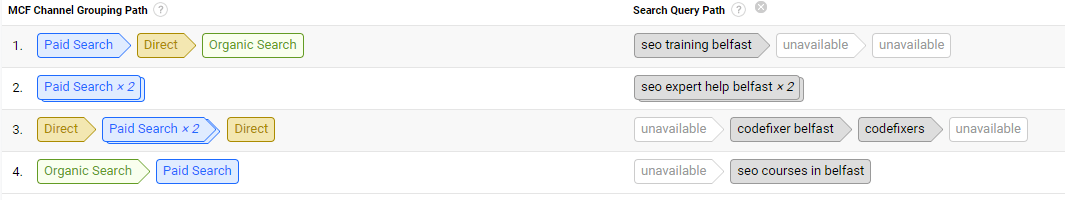
After following the steps above, with the search query path set as our secondary dimension, we can now see the individual searches each user has made.
We can also use the MCF Channel Grouping Path filter to show results, for example, for conversions where a user has interacted with a display ad and a search ad. This can be seen in the image below.
Now that you can better understand your customer journeys you should be able to use the information gathered to adjust your campaigns. I have only touched on a few different ways to experiment with your data, but there are tons of other experiments you can conduct for yourself!


